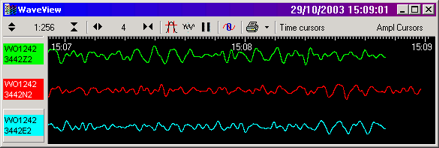
The WaveView Window
This window allows viewing of any number of stream waveforms over a full range of zoom factors. The application can have any number of these windows open at any time. Any stream may be viewed simultaneously in many different windows, each at a different zoom factor. Controls within this window are :
 or Up and Down arrow keys
 or Left and Right arrow keys
 or ‘N’ key
 or Pause key
 or ‘F’ key. Ctrl-F opens the filter-design window.
 or ‘M’ key
Streams may be moved between WaveView windows by dragging and dropping. To copy a stream display to another window, hold the Control key whilst dropping. An indicator shows where the dragged stream will be inserted when dropped.
To access the options for each WaveView window, and the associated stream views, use the popup menu for the window (Right click when the mouse cursor is inside the window). To perform an operation on a stream, ensure that it is focused.
The filter option allows a bandpass filter to be applied to the stream waveforms as they are drawn. The filter can be an in-built default, or a user-designed filter.
Two different default filters are available:
The width of the label panel on the left of the window can be increased or decreased to suit the length of the stream labels. To change the size, point the mouse at the right-edge of the panel where the cursor changes to a left-right arrow with vertical lines
( ), then click-and-drag the edge left or right. The stream labels will resize to fit the available space (subject to a maximum size).
The toolbar and caption bar (in Windows) can be hidden, using the ‘No Caption’ option in the popup menu. This maximises display area for the streams. Keyboard alternatives to the buttons on the toolbar are available so that the window appearance can still be changed when the ‘No Caption’ option is selected.
There are a number of keyboard shortcuts that can be used to change the display parameters of the WaveView window. These are listed below.
| Left/Right Arrow | Increase/Decrease the time scale. |
| Up/Down Arrow | Increase/Decrease the amplitude scale |
| Pause | Toggle the pause mode |
| N | Null, or calculate the offsets |
| F | Toggle the bandpass filter on or off |
| Ctrl-F | Opens the Filter Designer Window |
| P | Toggle the spectrogram display on or off |
| +/- | Increase/Decrease the brightness of the spectrogram of the selected stream |
| S | Call up the stream scaling dialog box |
| D | Show the Details popup window for the focused stream. |
| C | Display the Colour selection dialog box for the active stream. |
| Del | Delete the active stream from the WaveView window. |
| F5 | Redraw the WaveView window contents |
| Ctrl-Del | Clear ALL streams from the WaveView window (Clear Window). |
The spectrogram is plotted linearly, where the top of the ‘band’ represents ½ the sample rate (the ‘Nyquist’ frequency), and the bottom of the band represents DC. For ‘temperature’ colour coding, a natural log rule is used to provide maximum sensitivity at low signal levels, whilst providing a large total range.
See Also:
Offsets, Measurement cursors, Data Selection, MatLab interface