What sets time axis apart from the other kinds of plot axes is the numerous ways in which we
may want to tick and annotate the axis. Not only do we have both primary and secondary annotation
items but we also have interval annotations versus tickmark annotations, numerous time units,
and several ways in which to modify the plot. We will demonstrate this flexibility with a
series of examples. While all our examples will only show a single ![]() -axis, time-axis is supported for all axes.
-axis, time-axis is supported for all axes.
Our first example shows a time period of almost two months in Spring 2000. We want to annotate the month intervals as well as the date at the start of each week:
gmtset PLOT_DATE_FORMAT -o ANNOT_FONT_SIZE_PRIMARY +9p
psbasemap -R2000-4-1T/2000-5-25T/0/1 -JX6T/0.2 -Bpa7Rf1d -Bsa1OS -P > GMT_-B_time1.ps
These commands result in Figure 4.11. Note the leading hyphen in the PLOT_DATE_FORMAT removes leading zeros from calender items (e.g., 02 becomes 2).
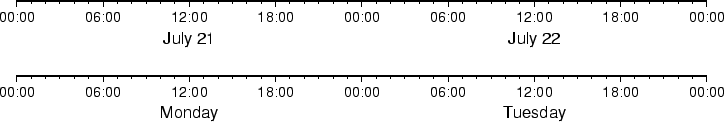
The next example shows two different ways to annotate an axis portraying 2 days in July 1969:
gmtset PLOT_CLOCK_FORMAT hh:mm
psbasemap -R1969-7-21T/1969-7-23T/0/1 -JX6t/0.2 -Bpa6Hf1h -Bsa1KS -P -K > GMT_-B_time2.ps
gmtset PLOT_DATE_FORMAT "o dd"
psbasemap -R -JX -Bpa6Hf1h -Bsa1DS -O -Y0.65i >> GMT_-B_time2.ps
The lower example (Figure 4.12) chooses to annotate the weekdays (by specifying a1K) while the upper example choses dates (by specifying a1D). Note how the clock format only selects hours and minutes (no seconds) and the date format selects a month name, followed by one space and a two-digit day-of-month number.
The third example presents two years, annotating both the years and every 3rd month.
gmtset PLOT_DATE_FORMAT o TIME_FORMAT_PRIMARY Character
psbasemap -R1997T/1999T/0/1 -JX6T/0.2 -Bpa3Of1o -Bsa1YS -P > GMT_-B_time3.ps
Note that while the year annotation is centered on the 1-year interval, the month annotations must be centered on the corresponding month and not the 3-month interval. The PLOT_DATE_FORMAT selects month name only and PLOT_FORMAT_PRIMARY selects the 1-character, upper case abbreviation of month names using the current language (selected by TIME_LANGUAGE).
The fourth example (Figure 4.14) only shows a few hours of a day. We select both primary and secondary annotations, ask for a 12-hour clock, and let time go from right to left:
gmtset PLOT_CLOCK_FORMAT -hham
psbasemap -R0.2/0.35/0/1 -JX-6t/0.2 -Bpa15mf5m -Bsa1HS -P > GMT_-B_time4.ps
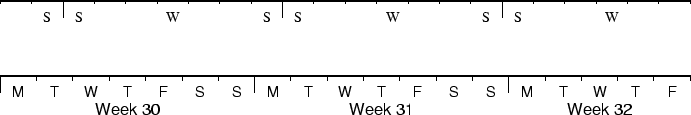
The fifth example shows a few weeks of time (Figure 4.15). The lower axis shows ISO weeks with week numbers and abbreviated names of the weekdays. The upper uses Gregorian weeks (which start at the day chosen by TIME_WEEK_START); they do not have numbers.
gmtset PLOT_DATE_FORMAT u TIME_FORMAT_SECONDARY full
psbasemap -R1969-7-21T/1969-8-9T/0/1 -JX6t/0.2 -Bpa1K -Bsa1US -P -K > GMT_-B_time5.ps
gmtset PLOT_DATE_FORMAT o TIME_WEEK_START Sunday TIME_FORMAT_PRIMARY Char TIME_FORMAT_SECONDARY Char
psbasemap -R1969-7-18T/1969-8-9T/0/1 -JX6t/0.2 -Bpa3Kf1k -Bsa1rS -O -Y0.65i >> GMT_-B_time5.ps
Our sixth example shows the first five months of 1996, and we have annotated each month with an abbreviated, upper case name and 2-digit year. Only the primary axes information is specified.
gmtset PLOT_DATE_FORMAT "o yy" TIME_FORMAT_PRIMARY Abbreviated
psbasemap -R1996T/1996-6T/0/1 -JX6T/0.2 -Ba1Of1dS -P > GMT_-B_time6.ps
Our seventh and final example illustrates annotation of year-days. Unless we specify the formatting with a leading hyphen in PLOT_DATE_FORMAT we get 3-digit integer days. Note that in order to have the two years annotated we need to allow for the annotation of small fractional intervals; normally such truncated interval must be at least half of a full interval.
gmtset PLOT_DATE_FORMAT jjj TIME_INTERVAL_FRACTION 0.05
psbasemap -R2000-12-15T/2001-1-15T/0/1 -JX6T/0.2 -Bpa5Df1d -Bsa1YS -P > GMT_-B_time7.ps