Next: 4.4.3.4 Cartesian exponential axes
Up: 4.4.3 Map frame and
Previous: 4.4.3.2 Cartesian linear axes
Contents
Index
Due to the logarithmic nature of annotation spacings, the stride parameter takes on specific
meanings. The following concerns are specific to log axes:
- stride must be 1, 2, or 3. Annotations/ticks will
then occur at 1, 1-2-5, or 1,2,3,4,...,9, respectively, for each magnitude range.
- Append l to stride. Then, log
 of the annotation
is plotted at every integer log value (e.g.,
of the annotation
is plotted at every integer log value (e.g.,  will be annotated as ``2'')
[Default annotates
will be annotated as ``2'')
[Default annotates  as is].
- Append p to stride. Then, annotations appear as 10
raised to log of the value (e.g.,
 ).
).
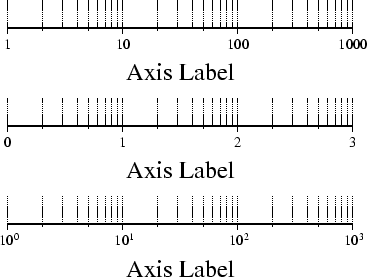
Figure 4.9:
Logarithmic projection axis using separate values for annotation,
frame, and grid intervals. (top) Here, we have chosen to annotate the actual
values. Interval = 1 means every whole power of 10, 2 means 1, 2, 5 times
powers of 10, and 3 means every 0.1 times powers of 10. We used
-R1/1000/0/1 -JX3l/0.4 -Ba1f2g3.
(middle) Here, we have chosen to
annotate log of the actual values, with -Ba1f2g3l.
(bottom) We annotate every power of 10 using log of the actual values
as exponents, with -Ba1f2g3p.
|
|
Next: 4.4.3.4 Cartesian exponential axes
Up: 4.4.3 Map frame and
Previous: 4.4.3.2 Cartesian linear axes
Contents
Index
Paul Wessel
2006-05-31