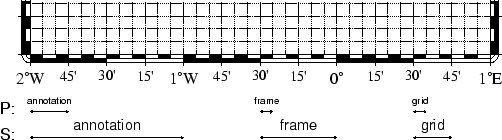
Geographic basemaps may differ from regular plot axis in that some projections support a ``fancy'' form of axis and is selected by the BASEMAP_TYPE setting. The annotations will be formatted according to the PLOT_DEGREE_FORMAT template and DEGREE_SYMBOL setting. A simple example of part of a basemap is shown in Figure 4.6.
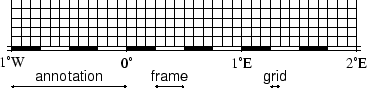 |
The machinery for primary and secondary annotations introduced for time-series axes can also be utilized for geographic basemaps. This may be used to separate degree annotations from minutes- and seconds-annotations. For a more complicated basemap example using several sets of intervals, including different intervals and pen attributes for grid lines and grid crosses, see Figure 4.7.