In the next example we will use the bathymetry values along the transect as our label, with placement determined by the distance along track. We choose to place labels every 1500 km. To do this we need to pull out those records whose distances are multiples of 1500 km and create a ``fixed points'' file that can be used to place labels and specify the labels. This is done with awk.
awk '{if (NR > 1 && ($3 % 1500) == 0) print $1, $2, int($5)}' transect.d > fix2.d
pscoast -R50/160/-15/15 -JM5.5i -Glightgray -A500 -K -P > GMT_App_O_8.ps
grdcontour geoid.grd -J -O -K -B20f10WSne -C10 -A20+d+um+s8 -Gl50/10S/160/10S -S10 \
-T:-+ >> GMT_App_O_8.ps
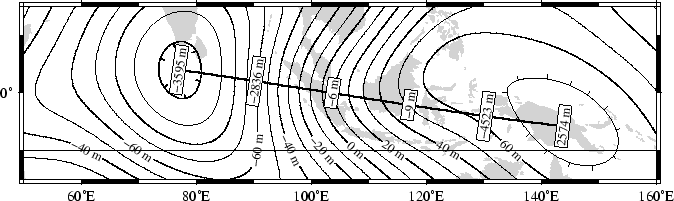
psxy -R -J -O -Sqffix2.d:+g+an+p+Lf+um+s8 -W1p transect.d >> GMT_App_O_8.ps
The output is presented as Figure O.8.
 |